Pasture biomass mapping
The uplands areas of the Jura Mountains are characterised by grassy pastures (or grassland) along the series of valleys that make up the mountains. These pastures have isolated single trees (usually conifers) or groups of trees and rocky patches. The valley areas are usually divided into a series of farms, each of which has a chalet d'alpage (alpine chalet) that provides accommodation in the summer during the grazing season and in some cases milking facilities for a farm's herd. Herds are traditionally milk herds but are increasingly becoming beef and/or breeding herds.
The pastures are surrounded by forests, both forest plantations and forests based on natural forests, many of which are managed in the sense that commercial logging is carried out.
The mountain pastures are an important defining aspect of the Jura Mountains (some 20% of the uplands are covered by pastures). It is therefore interesting and useful to understand how the pastures change from late-spring to early autumn while they are being grazed.
Ideally, it may even be possible to map and monitor the movement of the herds so that vistors can avoid encountering herds while visiting the mountains, much of which forms part of Jura Mountain national park. We are mainly interested in the area (see main map) to the north-east of Saint-Cergue in the Swiss communes of Saint-Cergue, Arzier and Bassins that forms part of the Parc Jura Vaudois.
Pastures
Using satellite imagery for vegetation mapping is well established and used widely, notably for understanding grazing dynamics. The predominantly smooth, grassy areas of pastures in the Jura Mountains can be mapped visually using SwissTopo aerial and Google Earth satellite imagery and relief mapping using a Digital Elevation Model (in our case the high-resolution SwissTopo swissAlti3D product) as shown on the main map. These grassy areas are drawn (see the editing version of the pasture map) using an approximately 10-metre wide buffer between a grassy area and the surrounding forest and then removing groups of trees and their 10-metre buffer. Areas covered by isolated single trees are not extracted.
To better define grassy areas, QGIS is used to obtain a Maximum Value Composite (MVC) of the SeLI biomass index used to quantify biomass (see below) for the months of May to October. Grassy areas are taken to be those areas with a MVC SeLi value greater than 0.78 and manually determined not to contain rocky patches. Lush, grassy pastures in temperature climates generally have NDVI values above 0.6 (Ara et al, 2021). Since SeLI tends to be smaller than NDVI for a given type of vegetation, setting a SeLI cutoff value of 0.78 is a fairly stringent criterion.
Calculation of the mean SeLi for each month is as follows: using QGIS, the SeLi geotiff raster for each month is clipped using a paddock's geojson as a mask. QGIS's Zonal Statistics tool is then used to calculate the mean SeLI raster for the paddock, the mean value being obtained using QGIS's Attribute Table.
The MVC raster is calculated using QGIS's GDAL Raster Calculator with the formulae
- maximum(A,B)
- maximum(maximum(A,B),maximum(C,D))
for SeLi rasters A to D for 4 months. The MVC for 8 months simply requires repeating the second formula and maximising the two series. Extensive chaining is possible.
Our pasture map shows the grassy paddocks, outlined in red, for several farms. Each farm often has a boundary, usually in the form of dry stone walls combined with temporary fencing that replaces degraded walls. In many cases, satellite images but more generally ground truth can be used to identify the temporary fences that sub-divide paddocks. These fences are generally set up in early-spring and are often removed in early-autumn so that a herd can graze over a large area.
Biomass
Without going into too much detail, it is simply indicated that the Jura Mountains pasture biomass mapping uses the Sentinel-2 Leaf Area Index (SeLI) which exploits Sentinel 2 B5 red-edge (705nm) and B8A near-infra red (865nm) bands.
For 2020, cloud-free Sentinel2 MSI Level 2A images (mainly from Sentinel 2A but occasionally 2B) were downloaded from ESA's Copernicus open access Open Hub and the relevant bands are pan-sharpened to a resolution of 10 metres using the Windows 64-bit desktop version of the Sentinel Application Platform (SNAP) SuperResolution Sen2Res plugin. The SeLI is then calculated, and the generated geotiff image reprojected using QGIS from the EPSG 32631 projection to the EPSG 4326 projection. Map tiles are created using the QGIS gdal2tiles tool.
For 2021, Sentinel2 MSI Level 2A images for either satellite 2A or 2B do no seem to be available on the Copernicus OpenHub so Level 1C images for satellites 2A and 2B were downloaded. These could not be converted to Level 2A images using SNAP's Sen2Cor Version 2.9 plugin owing to the "space_craft name" error. Instead, the Sen2Cor Version 2.9 stand-alone was needed.
Maps
Some further comments on the results of the biomass mapping will be posted later. For the several areas that have been mapped so far it is noted that the highest level of biomass (designated using the lightest colour in the mapping) that arises in the spring before grazing starts is mainly removed between mid-July and mid-August.
The pasture map give a sidebar with the names of the farms and numbers are assigned to each of a farm's main paddocks. Clicking a paddock number brings up a popup showing the paddock's average SeLi for each month from June to October. Generally speaking, biomass peaks in June and decreases rapidly until mid-August owing to grazing in all paddocks. The biomass then recovers while grazing continues.
There are of course variations within paddocks for a given farm and between farms.
For some farms, grazing across all paddocks is less uniform, with some paddocks showing an earlier or delayed decrease in the biomass as herds are moved around.
It is also possible to identify the effect of closing off parts of a paddock using temporary fencing (see in the pasture map and in the image the difference between the north-western and south-eastern parts of paddock 7 in mid-September 2020 which are divided by a fence that is indicated as a red line).
In summary, the recently proposed and relatively simple multi-vegetation SeLI index that minimises saturation at high levels of biomass appears to provide a reliable and useful indicator for grazing dyanmics in Jura Mountain pastures. A complete mapping over several years is in progress.
The main aim is to establish the feature types that should be used in multi-sensor data extraction for unsupervised Local Climate Zone classification, possibly using the Dempster-Shafer Theory (see V. Saeidi et al).
Verification
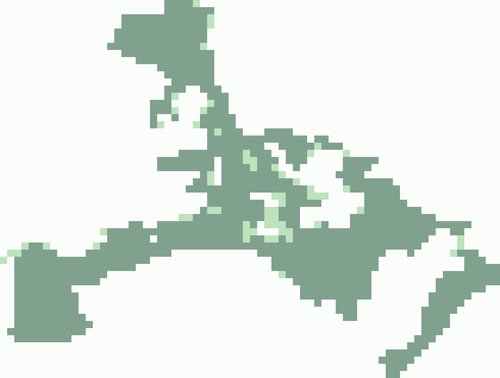
The image compares the grassy area of Grand Enne paddock 9 as determined using SeLi with the Version 1.5 cropland and grassland map of Switzerland based on Sentinel-2 data published by Envidat. The light green pixels correspond to pixels that SeLI classifies as grassland but are not classified by Envidat as grassland. The two approaches overlap and there are only a few light-green pixels. This observation confirms that the SeLI approach provides an accurate description of the Jura Mountain's grasslands in spite of using a single vegetation index (the Envidat mapping used MSAVI2 - a soil index, EVI - a vegetation index, and a modified NDVI as well as parameters such as the standard deviations and kurtoses of these indices and percentile values for NDVI time series).
June 2021